About the dataset:-
Name:-Telecom Churn Dataset
You can download it from here.
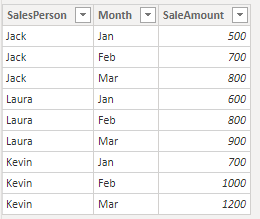
Here I going to list out some columns which is in the dataset.
- State: string
- Account length: integer
- Area code: integer
- International plan: string
- Total night calls: integer
- Total night charge: double etc…
Here I going to show some steps to create a dashboard using powerBI.
- Load the dataset using getdata.

2. After successfully adding your dataset go to your dataset and add some visuals.

3. After that I have created PI-chart for some columns.

4. Blow image you can see a map by state column and area code.

5. Stack Bar you can see in below image.

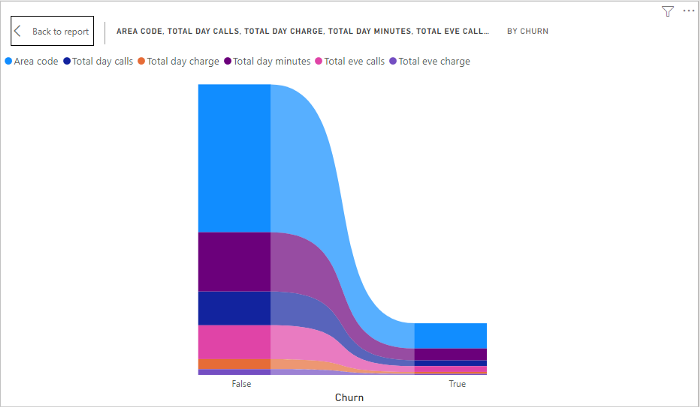
6. Ribbon chart in below image.
7. Donut Chart you can see in the below image.

8. After that I publish this dashboard on the internet.

9. Here you can see the dashboard was published on the internet.