Introduction to PowerBI and Get started with PowerBI, Prepare data for analysis and Model data in Power BI.

Power BI is a business analytics service by Microsoft. It aims to provide interactive visualizations and business intelligence capabilities with an interface simple enough for end-users to create their own reports and dashboards. It is part of the Microsoft Power Platform.
Which different types of visualizations do it povides?
Here are the visualizations types in Power BI:
1. Area Charts
2. Line Charts
3. Bar Charts
4. Column Charts
5. Combo Charts
6. Pie Charts, and many more..
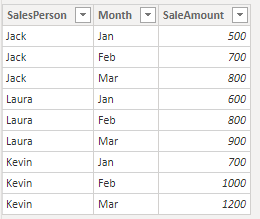
- Open PowerBI and load the dataset.

Fig. Load Excel Data Set
2. You can view your data in tabular form by clicking the Data icon.

Fig. Tabluer Form of dataset
3. Preparing data for analysis.

Fig. Convert data into fixed decimal
4. You can view the model view of data by clicking the model icon.

Fig. Model view for dataset